Toolbars and icons in Katalon Cloud Studio (Beta)
The following system features are added to perform Katalon Cloud Studio (Beta) actions. These buttons and icons are placed on the navigation bar and multiple user interfaces for you to create, record, run, and publish Katalon Cloud Studio (Beta) test cases.
Test Explorer view
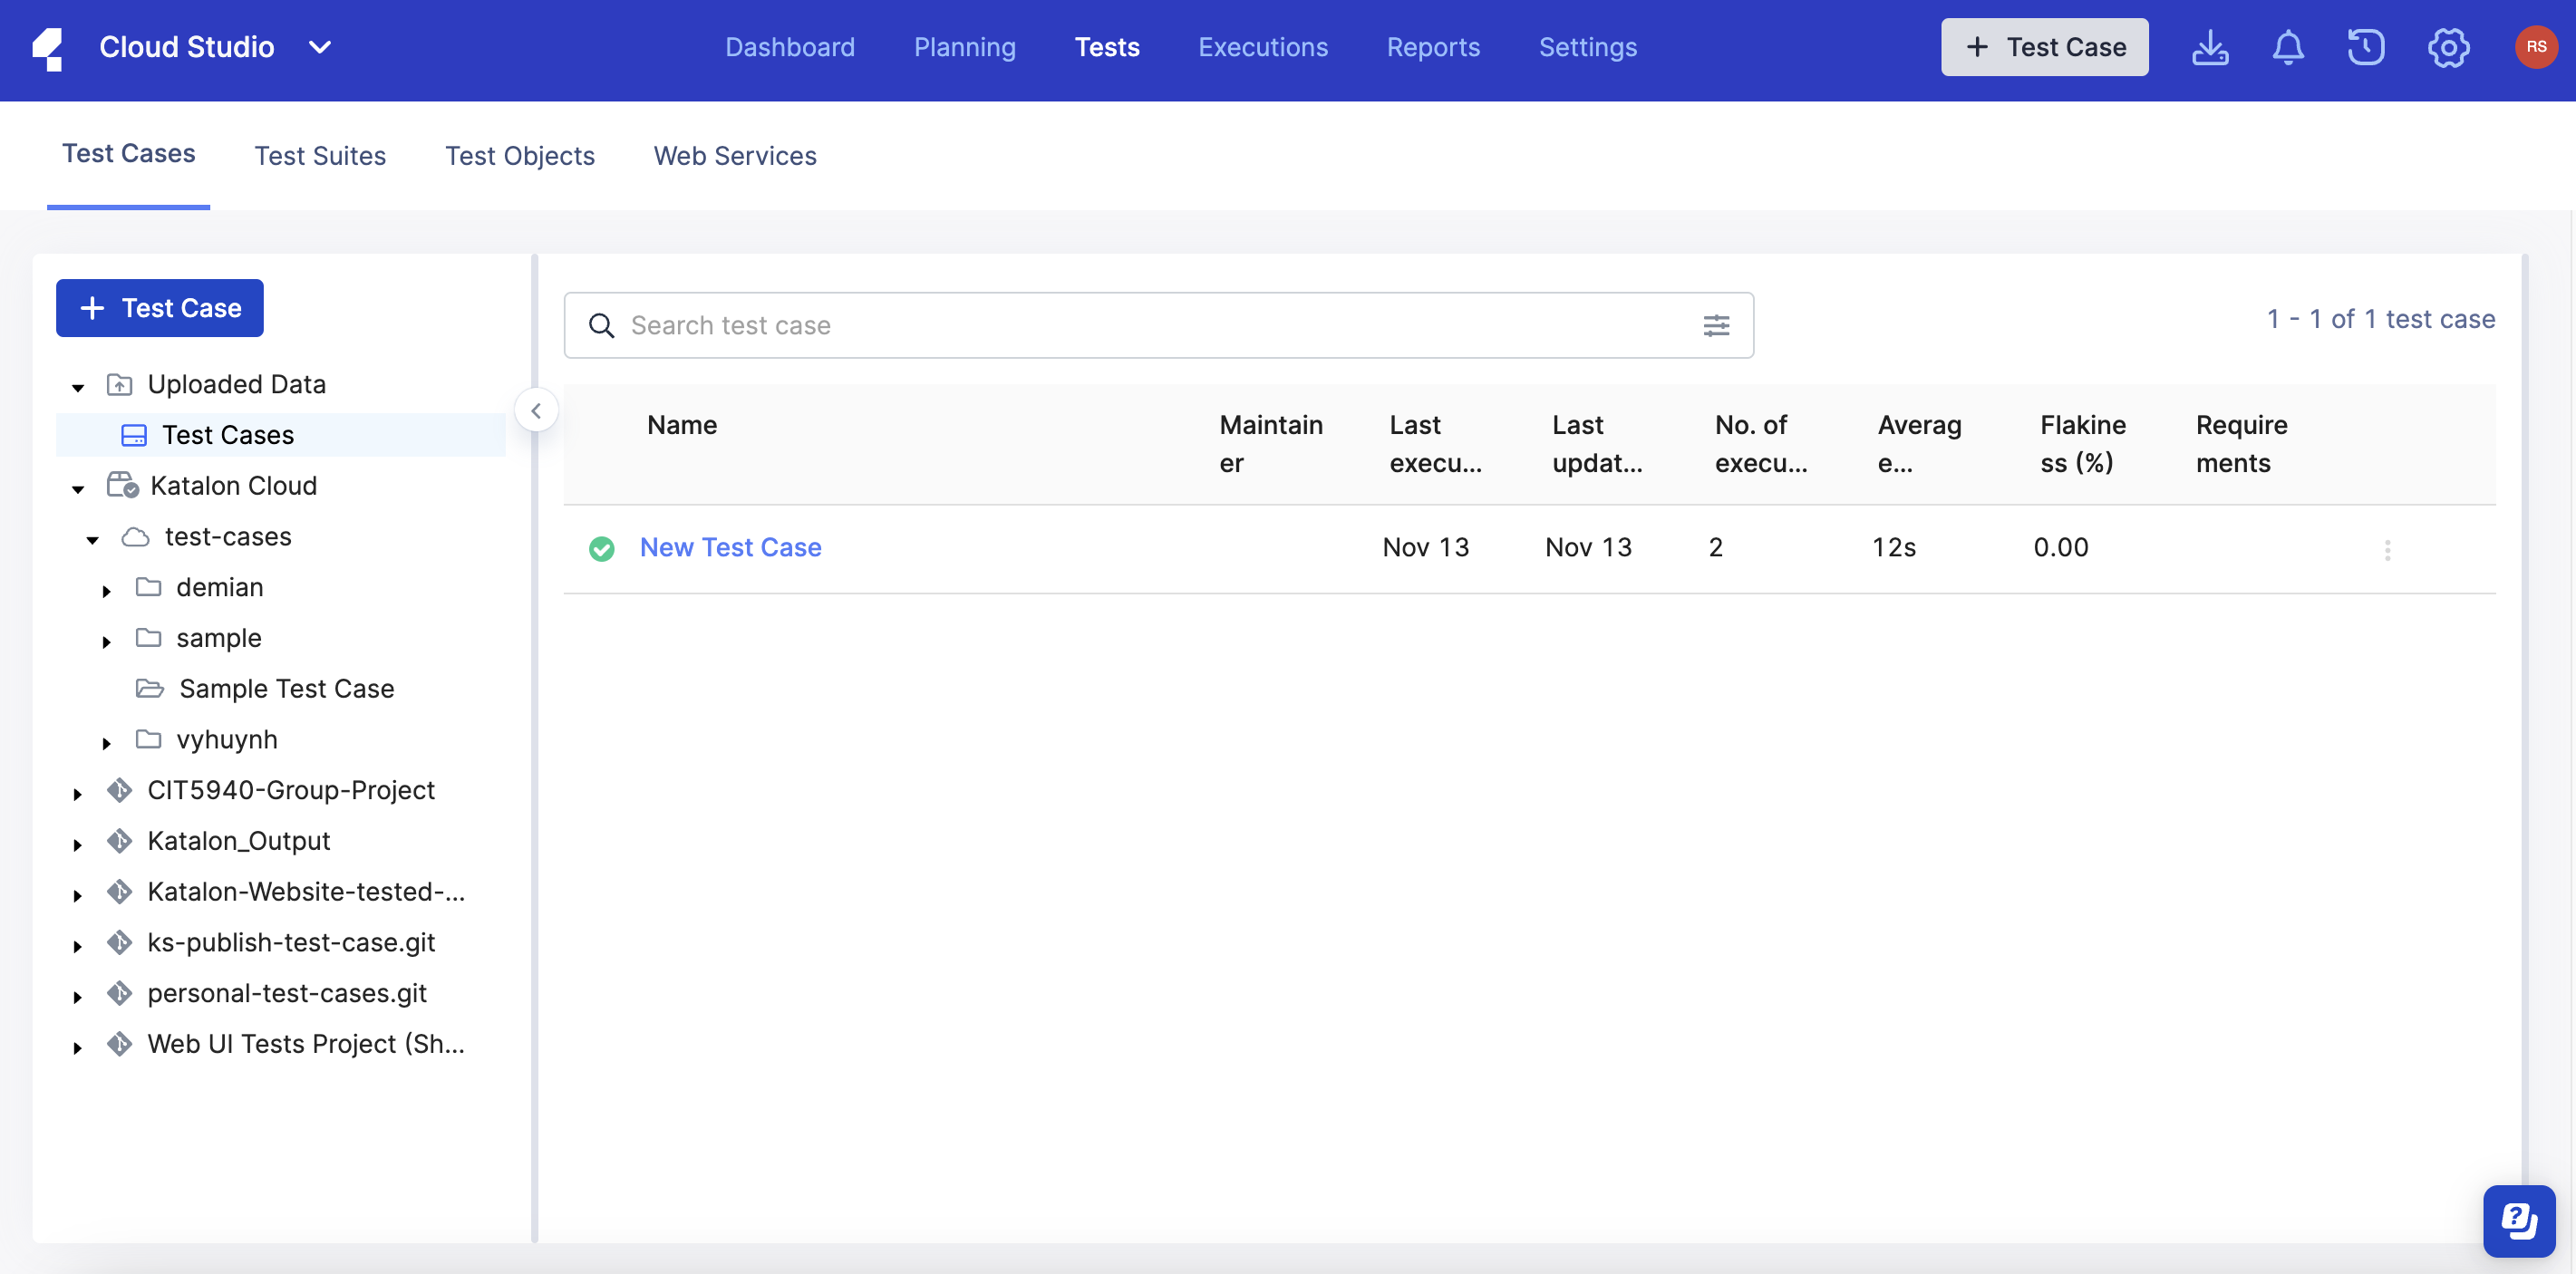
The Test Explorer view is where you can find all of your test automation assets, including your test cases. When you click Tests, the Uploaded Data folder, which contains all of your uploaded test cases, is selected on the left by default. On the right, all test cases under the selected folder are displayed in a table format, along with relevant information such as Last execution date, No. of executions, Flakiness, and more.
| Icon | Description |
|---|---|
 | Record new test case using default test website. You can delete and enter your preferred website address. |
 | Create a new blank test case. |
Editor view
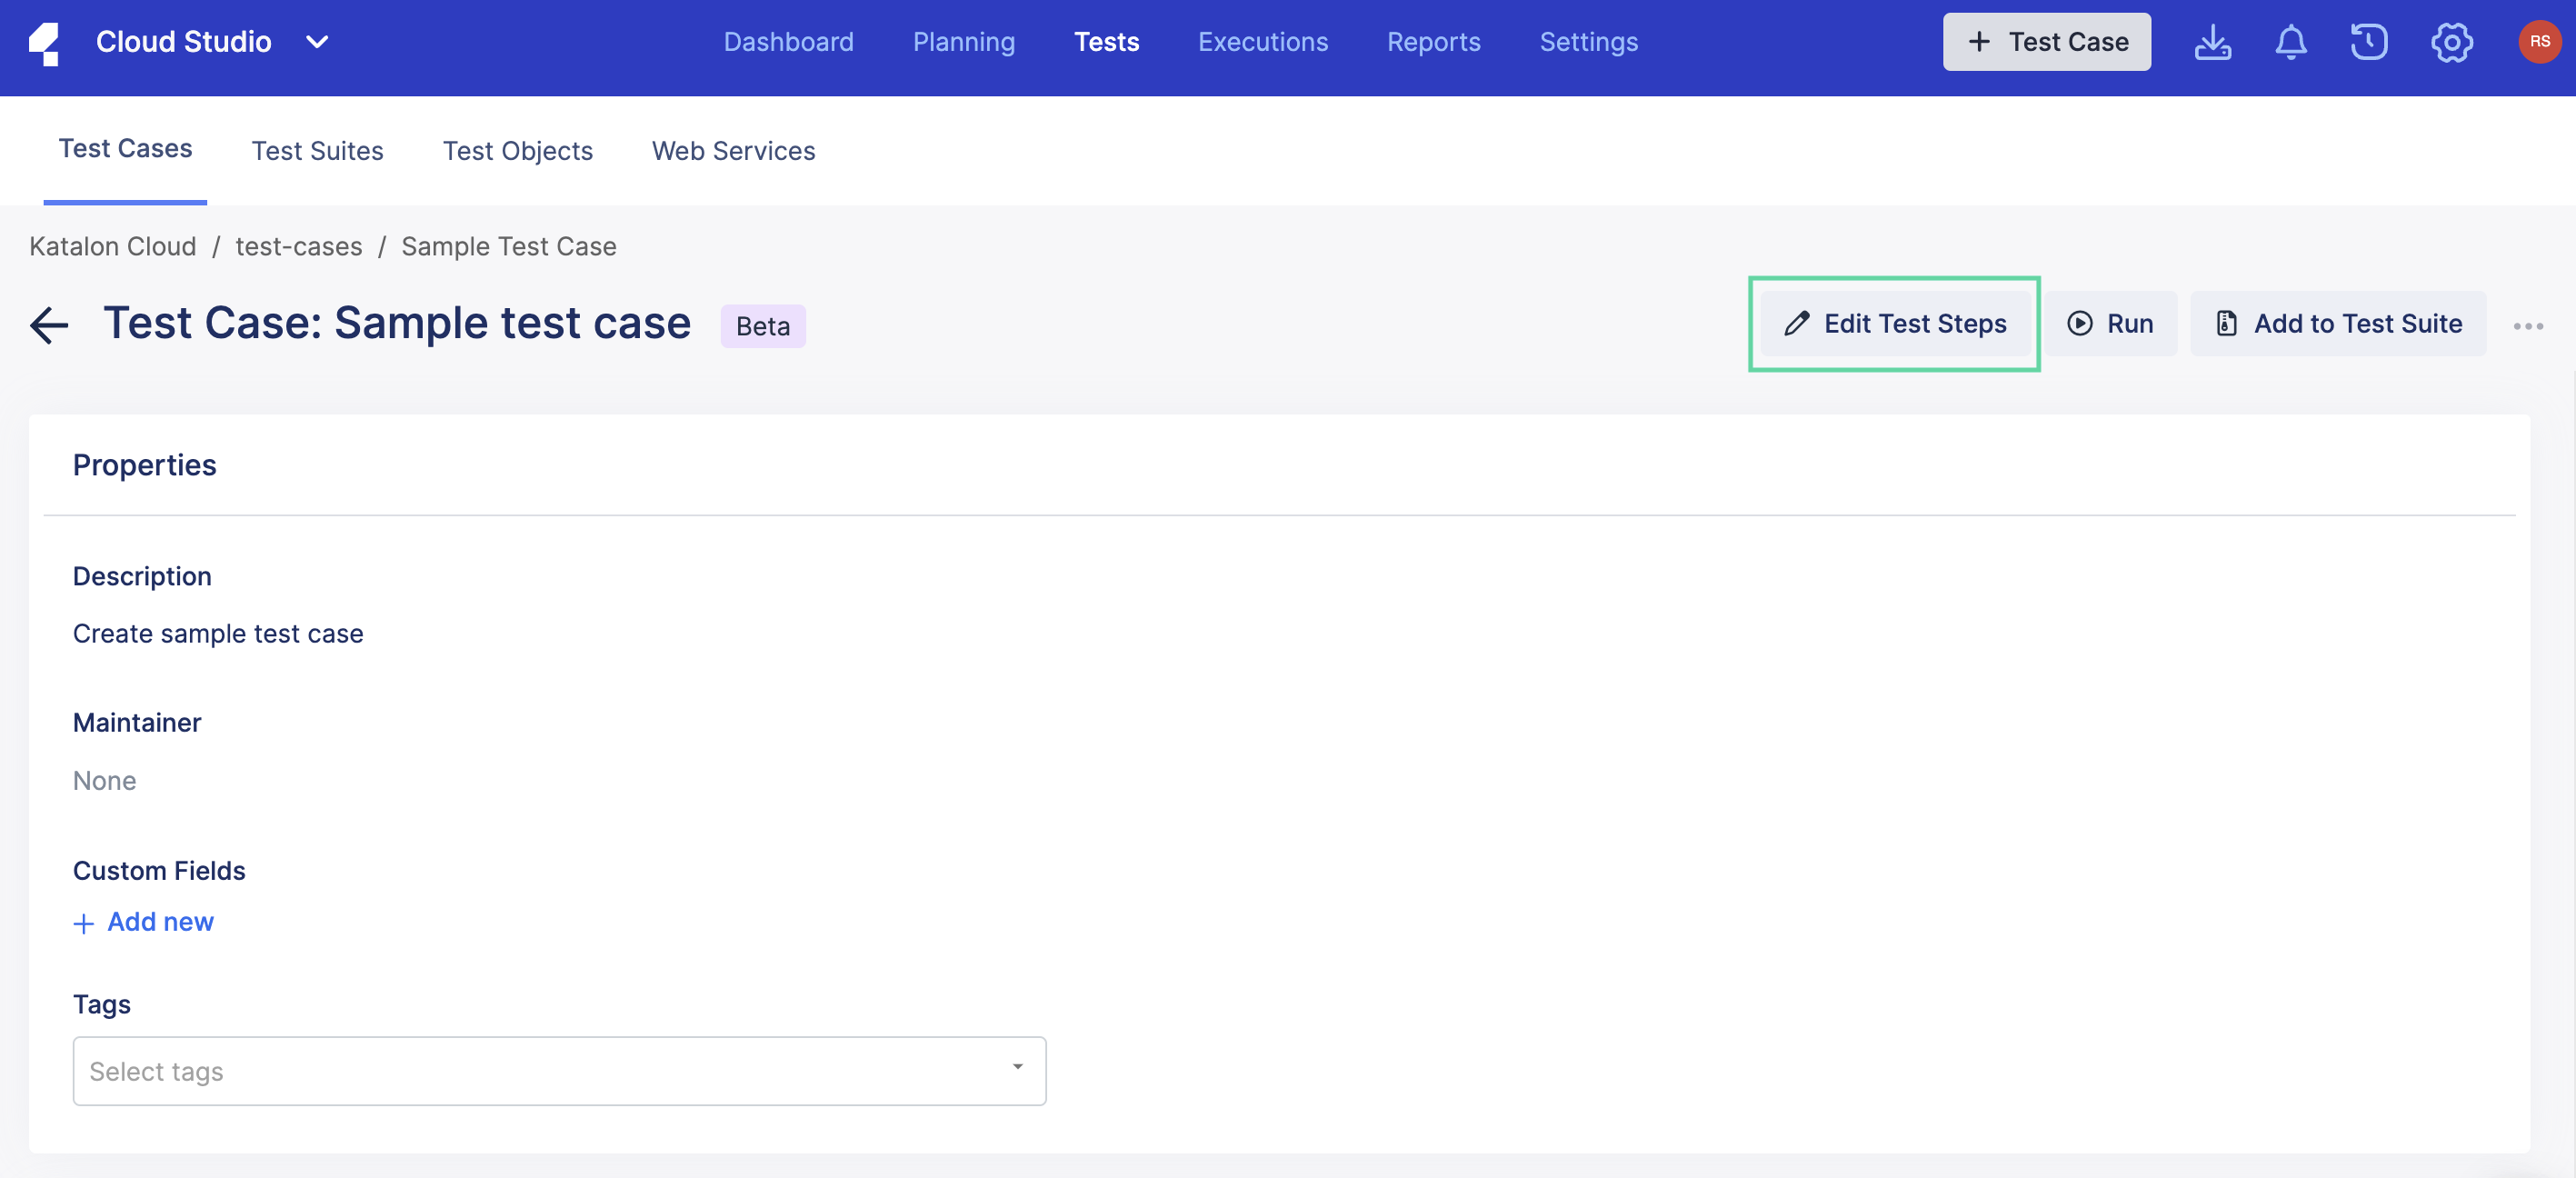
Clicking a test case from Test Explorer view directs you to a preview of the selected test case, which displays the test case title, description (which is editable), the Edit Test Steps, Instant Run, and Add to test suite buttons:
| Icon | Description |
|---|---|
 | Edit test steps; Opens up the Editor. |
 | Instantly run the test case. |
 | Add the test case to a test suite. |
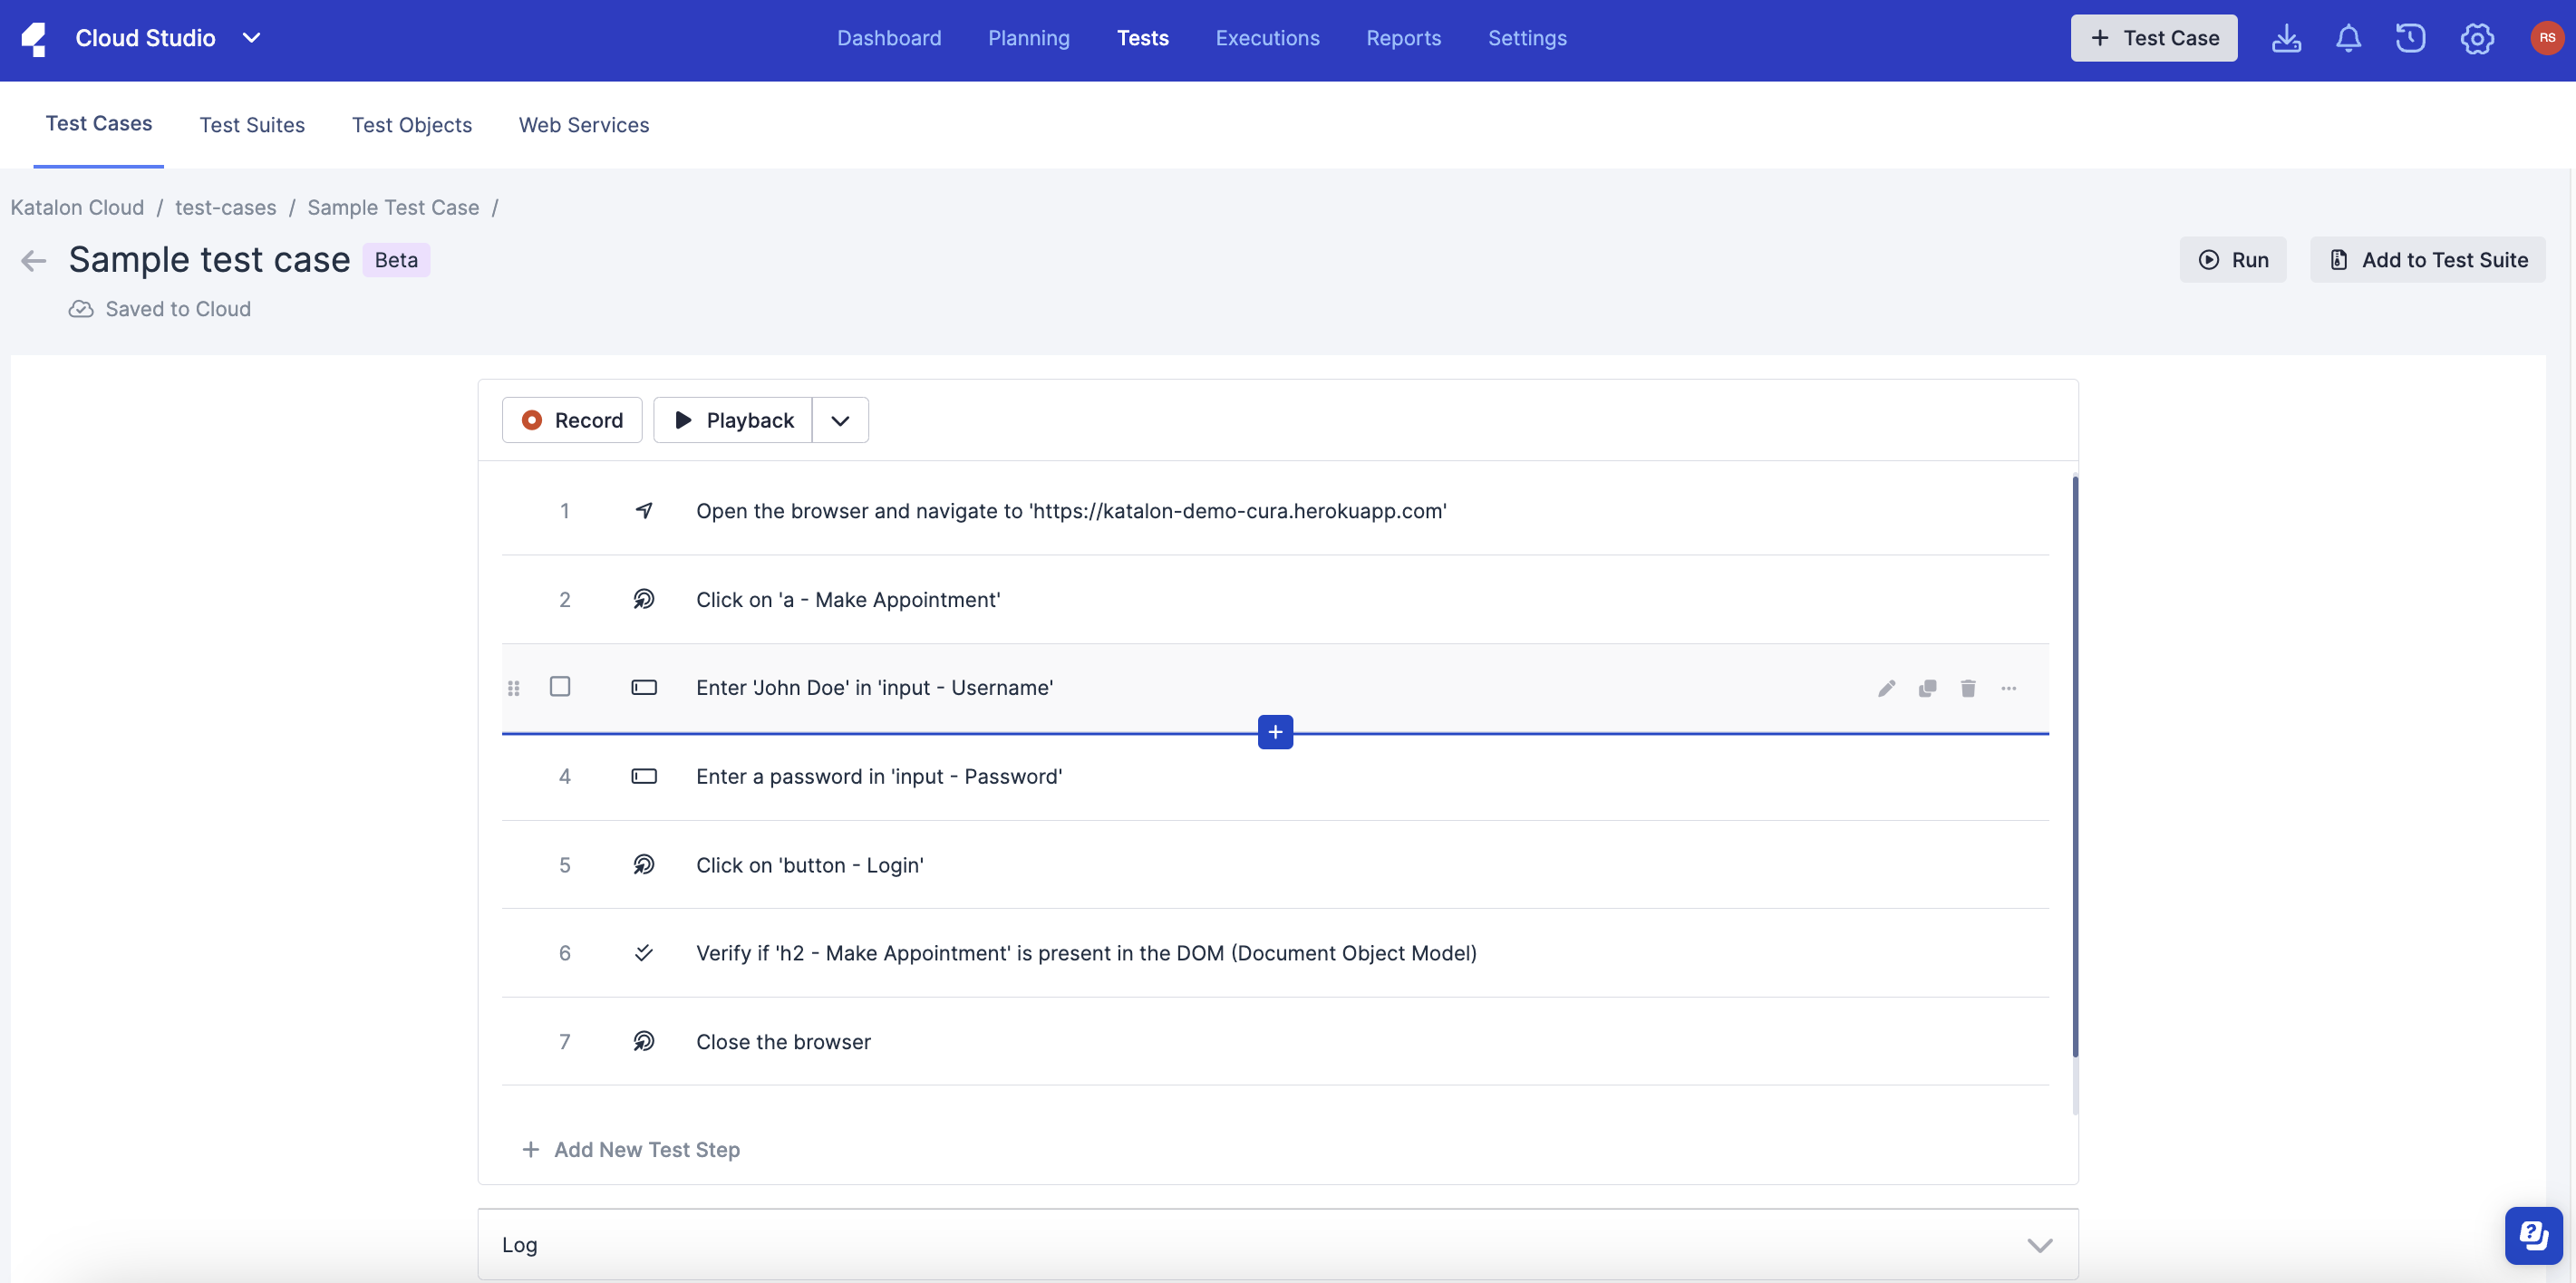
There is a visible Add New Test Step button for you to add a new test step from your preferred order. You can also use the contextual menu actions to perform inline actions. See: Edit a test case.
| Icon | Description |
|---|---|
 | Record manual test steps. |
 | Plays back your test case. You can click the dropdown arrow to playback using a test browser or TestCloud. |
 | Adds a new test step. |
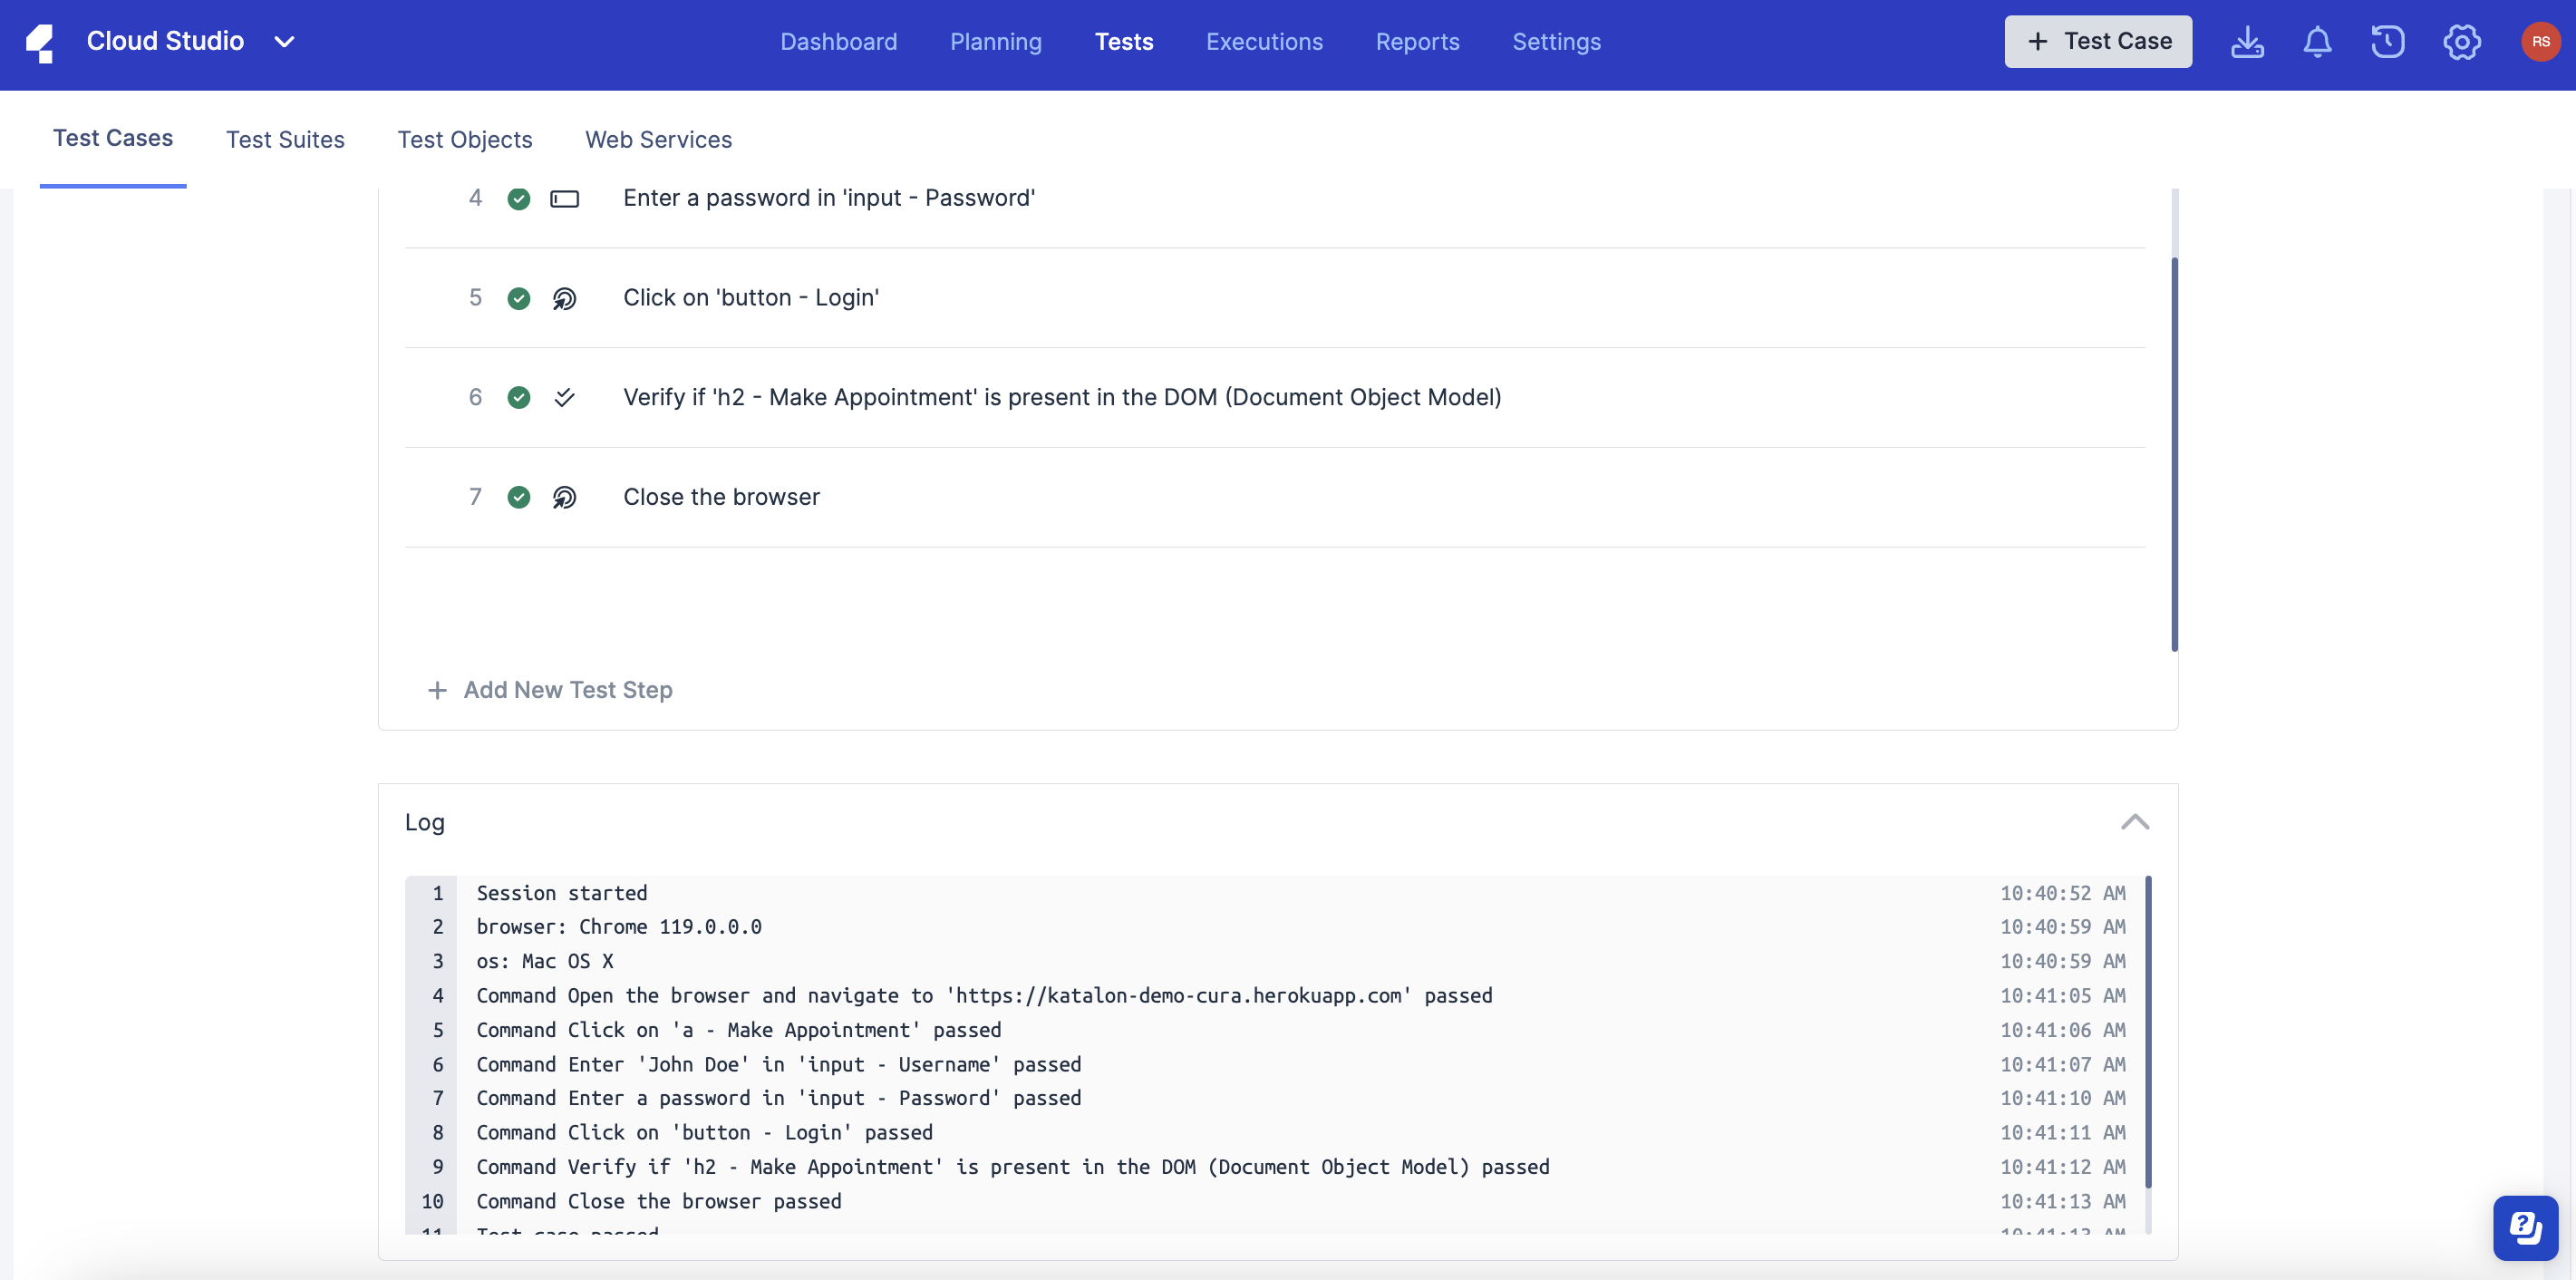
You can access the log of the latest playback of your test case by scrolling down to the Log section and click Log. Run a draft test case
Test browser view
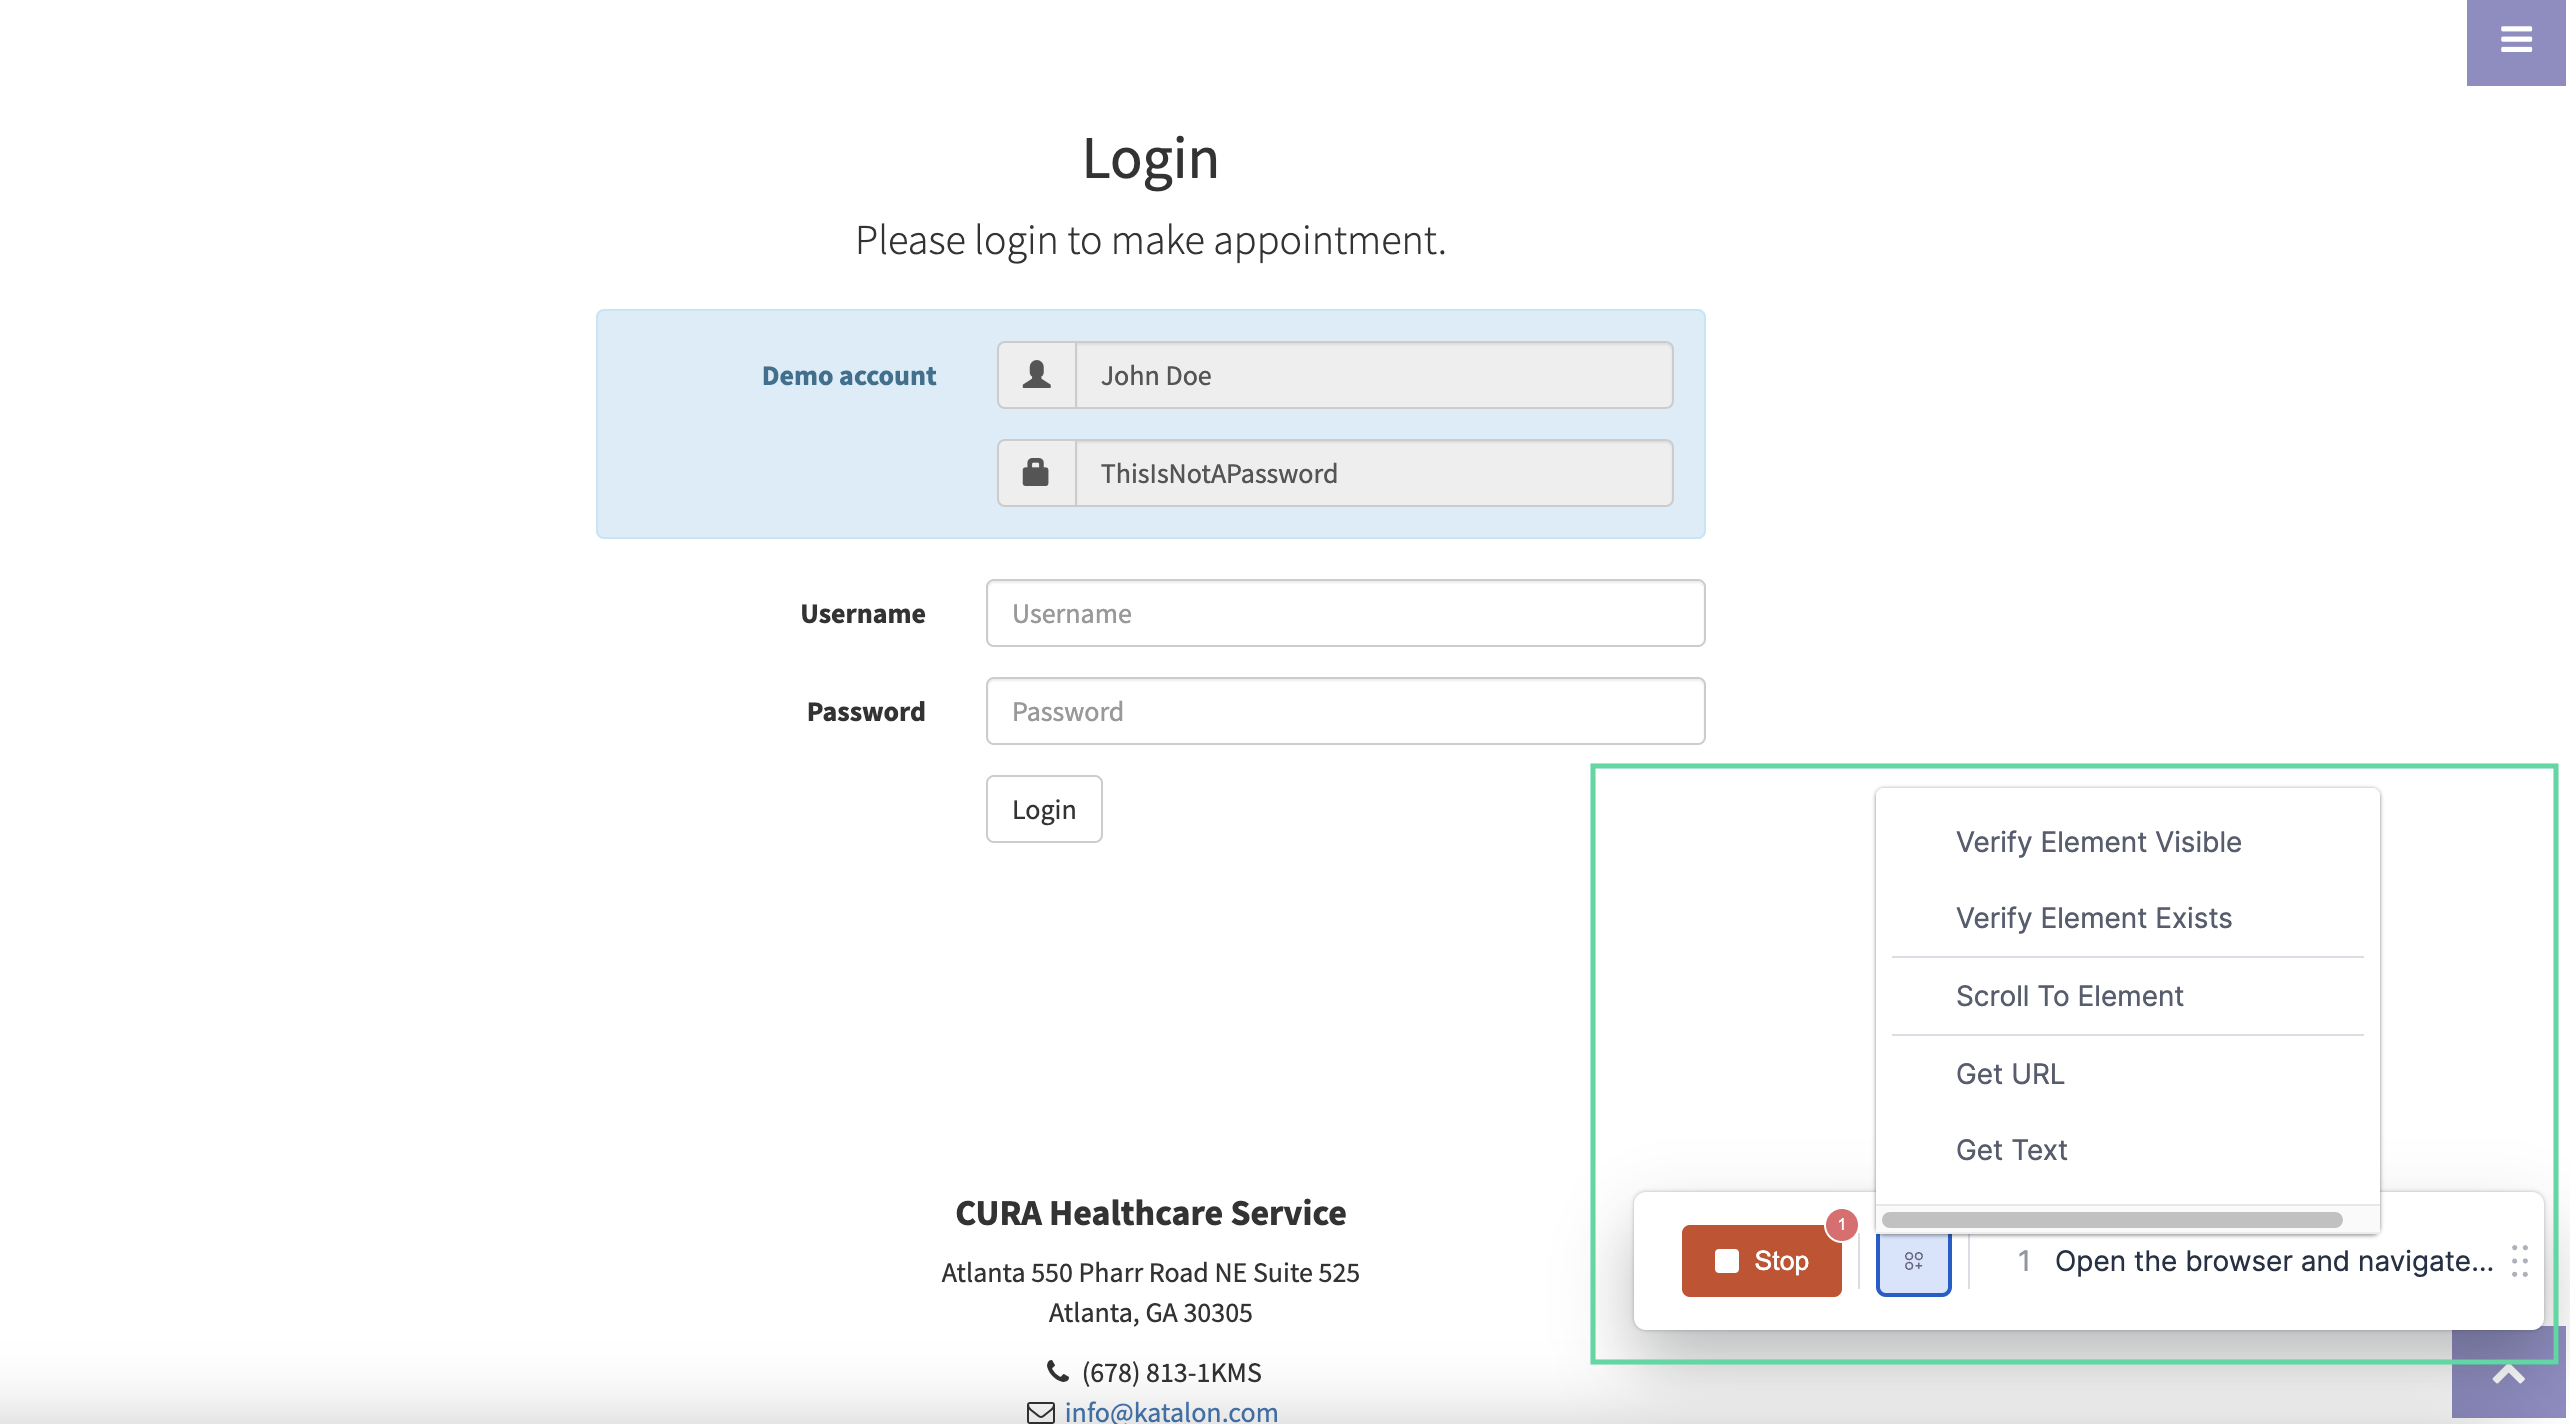
The Test browser view displays the website based on the app URL provided in the test case. The test browser view also includes a floating Special Actions menu. The floating menu shows the newly recorded step in plain English and allows you to record Supported Actions as additional test steps to your test case. You can also use the Special Actions menu to stop recording.
