Katalon Recorder GUI Overview
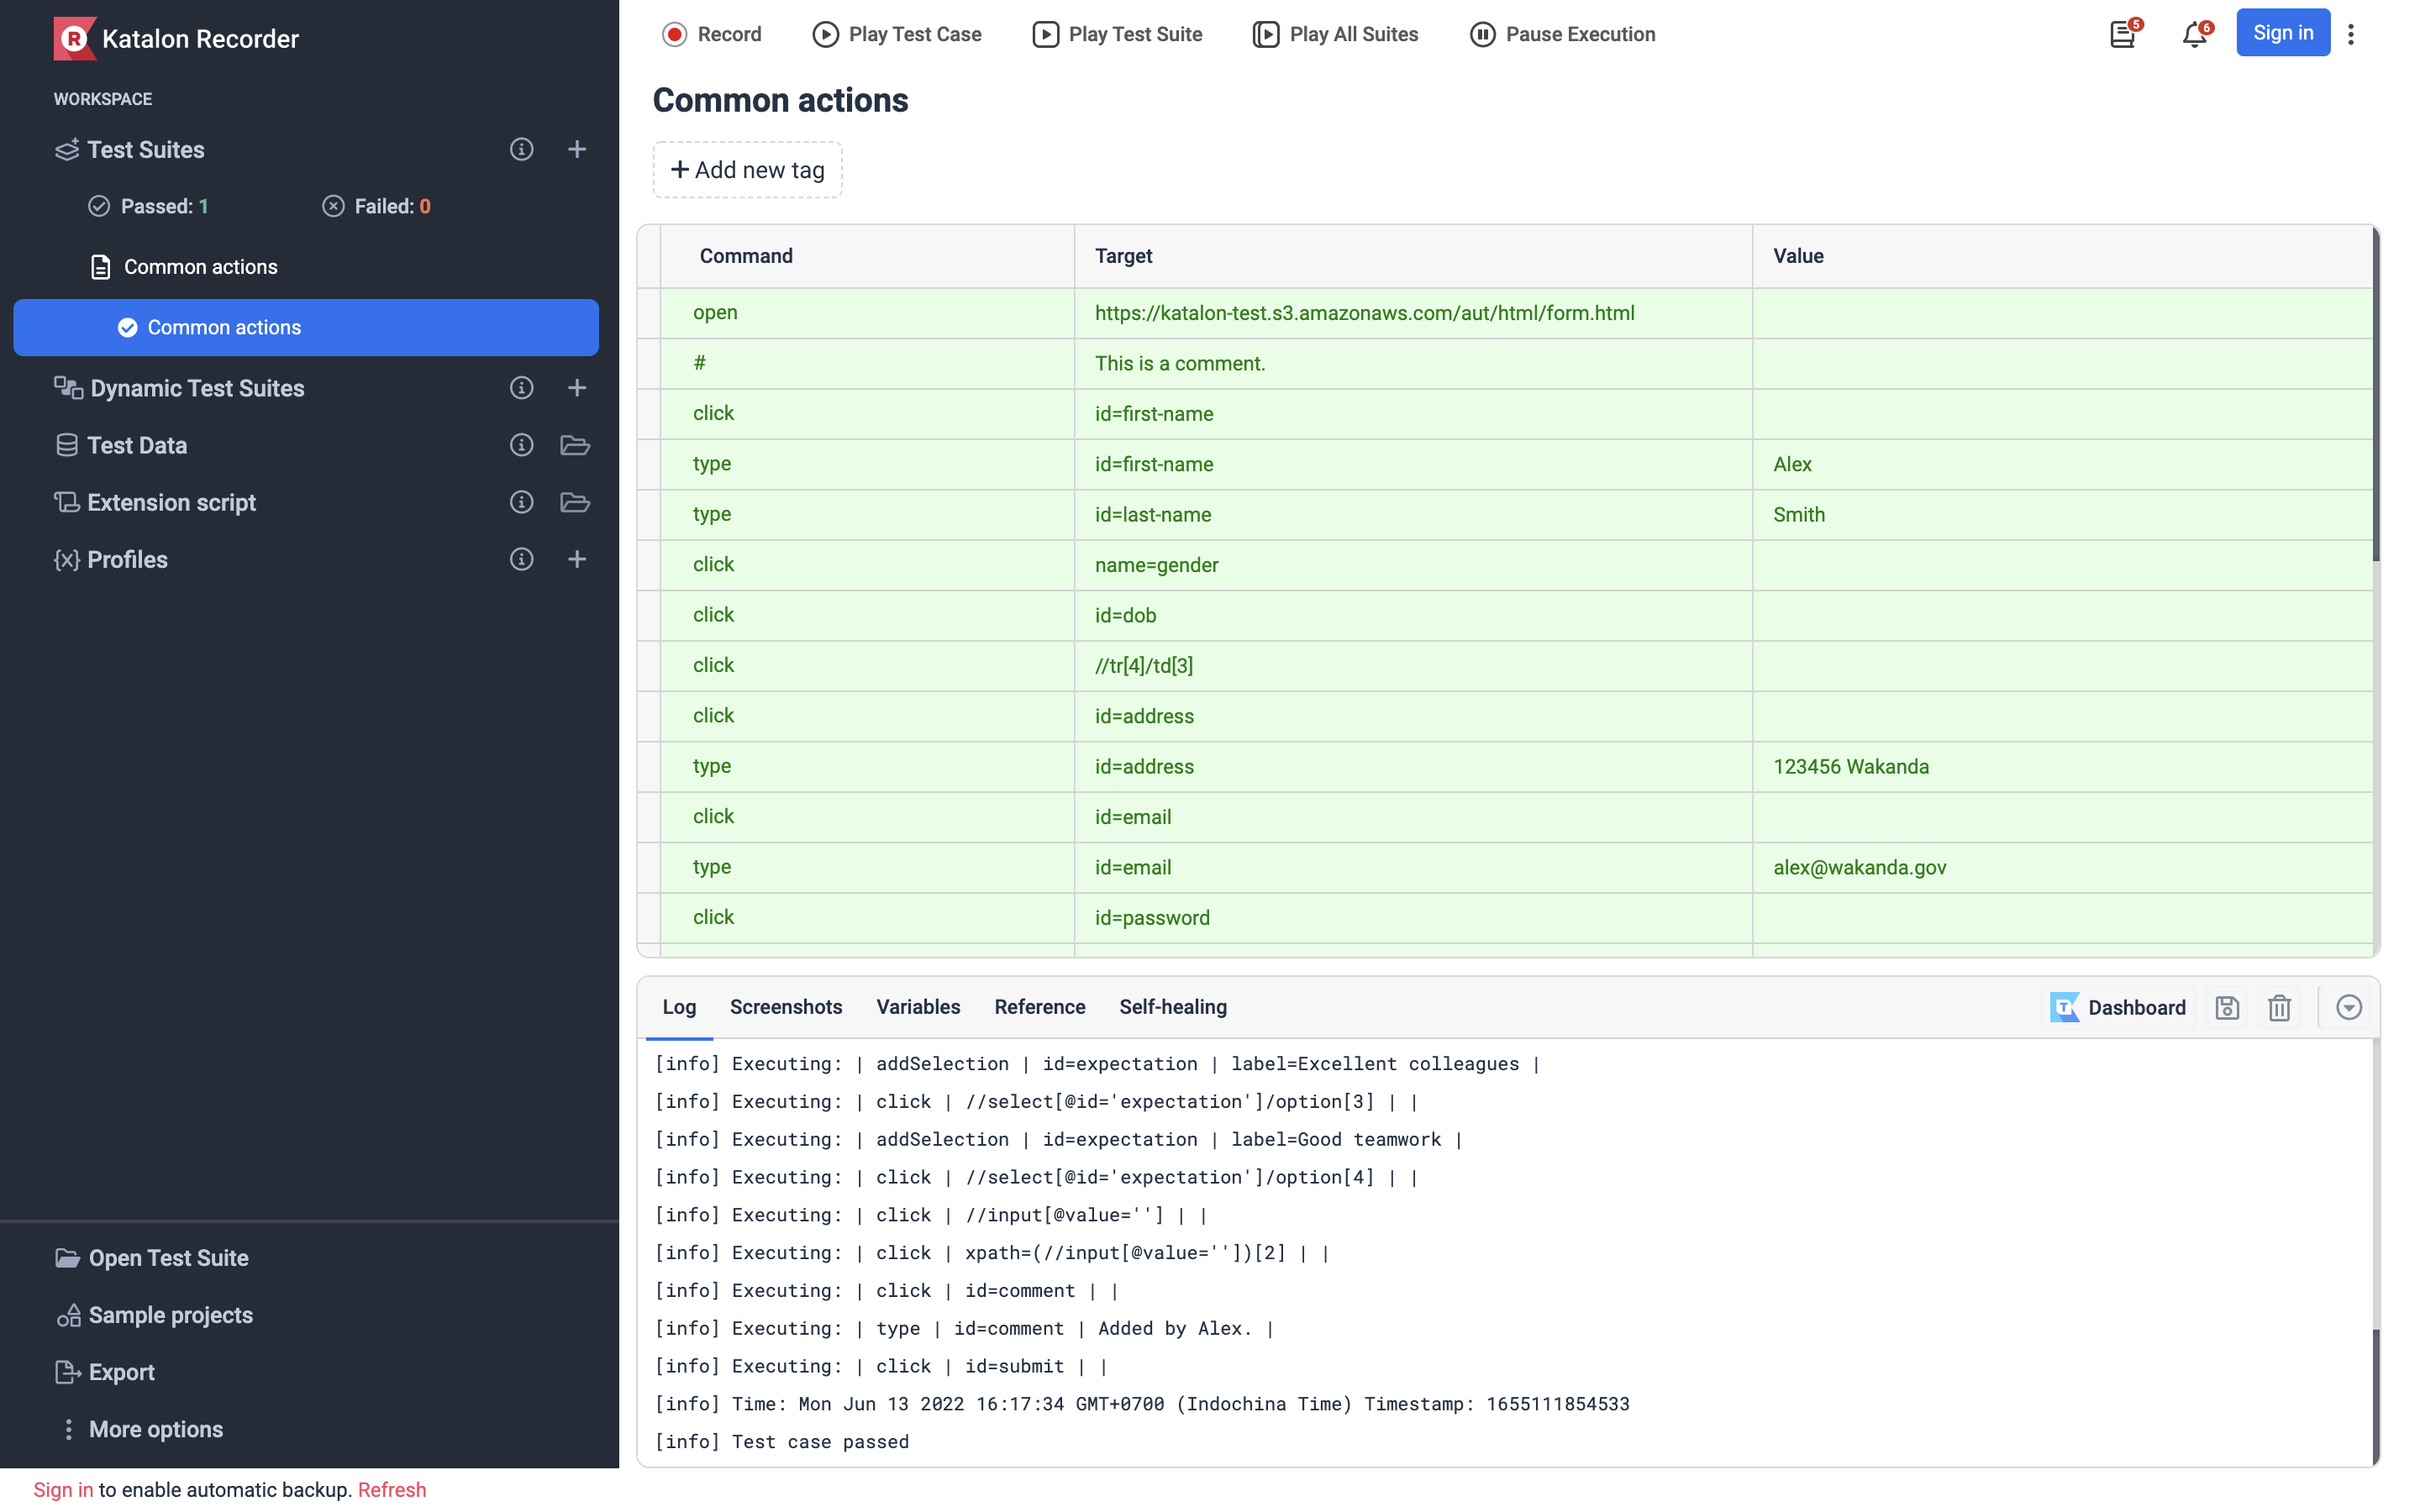
The Katalon Recorder main interface consists of four (4) sections:

Toolbar
The Katalon Recorder Toolbar contains buttons to help you to manage your web recording process.

| Button | Description |
|---|---|
| Record | Record automation test. |
| Play Test Case | Execute selected single test case. |
| Play Test Suite | Execute selected test suite. |
| Play All Suites | Execute all test suites. |
| Stop | Stop recording or stop the current execution. |
| Pause Execution | Pause the current execution. |
| Resume | Resume current execution. |
| User Manual | View Katalon Recorder onboarding tutorials. |
| Speed | Adjust execution speed. |
| Setting | Port configuration to change the default port used by Katalon Studio to communicate with the active browser. |
| Help | Get Katalon Recorder User Guide. |
| GitHub | Access Katalon Recorder public repository on GitHub. |
| Stats | Your daily stats for automated manual processes and executed automation scripts. |
Workspace
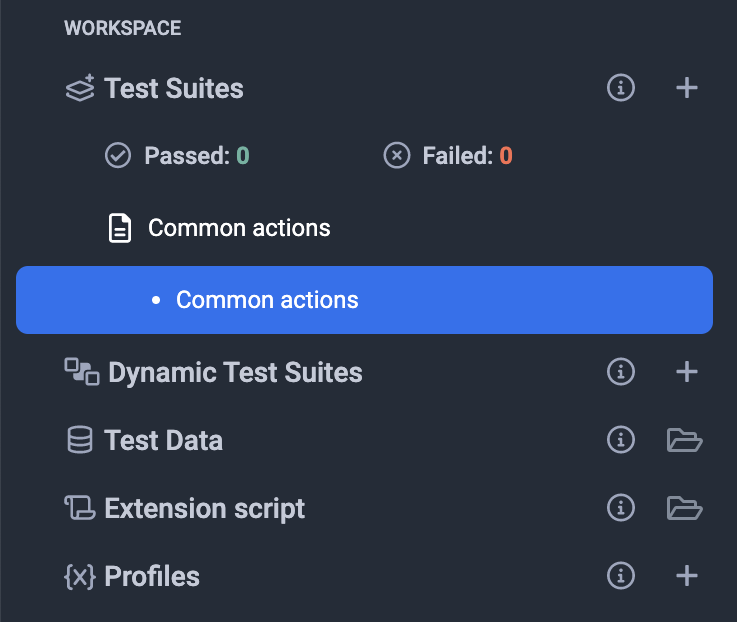
The Workspace displays the structure of the test suites, dynamic test suites, and associated test cases, helping you to organize, browse and quickly access to any test cases. Workspace also contains test data, extension scripts, and profile for using global variables. Open/Add Test Suite can be performed quickly by clicking on correspondent icons on the upper right corner.

Test execution status is also displayed here at the bottom. You can immediately observe the number of passed or failed tests.
Test Data
The Test Data tab allows you to upload CSV file for data-driven testing. You can also manage test data file by editing the name or removing unwanted data file. To learn more about data-driven testing using Katalon Recorder, refer to Data-driven testing in Katalon Recorder.
Test case details view
In Test case details view, Katalon Recorder displays recorded test script in the test case window. It displays command and its parameters in table format. You can also drag and drop any test step to organize the test case.
Editing test case
Katalon Recorder allows you to edit any recorded commands or added the new command at any point in the steps. Command, Target, Value display information of currently selected command. This entry field is modifiable.
To edit, select the step to be changed and edit it using the Command, Target, and Value fields. Command text field displays a drop-down menu to suggest commands based on the entering characters. Katalon Recorder supports most of the common Selenium commands.
- Actions – Commands that reproduce user interaction on the application under test.
- Accessors – Commands are used to store the results in variables.
- Assertions – Commands that verify the application under test behave as expected.
For more details about Selenium commands, refer to Selenium documentation: The Selenium Browser Automation Project.
For more detail list of support commands, refer to Selenese (Selenium IDE) Commands Reference.
Context menu
Right-click on any space in test case detail views to display the context menu. You can perform most of the essential actions for command at any preferred test step. Context menu contains:
Managing Test Case
| Command | Insert a new command in the currently selected step |
|---|---|
| Delete Command | Remove a single selected command. |
| Delete Multiple Command | Remove multiple commands of the currently selected test case. |
| Copy Command | Copy the currently selected command. |
| Paste Command | Paste a command at a particular test step. |
Debugging Test Case
| Control | Description |
|---|---|
| Toggle breakpoint | Set a breakpoint to stop at a specific command for debugging purposes. |
Execute
| Control | Description |
|---|---|
| Execute This Command | Run a single command for prompt feedback. |
You have multiple options when it comes to executing test cases in Katalon Recorder including Play a single test case, Play All test cases in test suites, Pause and Resume, or even execute a single command from context menu while composing automation test.
Artifacts
The Artifacts section consists of tabs that allows you to access various outputs and supplementary information generated during the testing process to aid in test execution, debugging, and analysis. These artifacts are crucial for maintaining and improving the quality of the software being tested.
Log
The Log tab shows the real-time report/log of the test execution. All execution errors message, information message and execution progress is displayed here.
Screenshot
The Screenshot tab shows all captured screenshot of the keyword in captureEntirePageScreenshot test case.

Reference
The Reference tab displays the detail documentation of selected command. It helps you to ensure the correct types and the number of parameters for the command.

Variable
The Variable tab display detail information the currently selected command. You can view command name, target, and values in this tab while the test is executing.
Self-healing
When a default locator fails, Self-healing finds alternative locators to complete the test execution. After the test execution is completed, you can choose to replace failing locators by approving Self-Healing suggestions in the Self-healing tab. To learn more about Self-healing, see Use the Self-Healing function.

Upload to Katalon TestOps
The Katalon TestOps icon allows you to upload execution logs to Katalon TestOps and keep track of execution history, access to the test automation smart dashboard, and reports.